Cryptocurrency Market Analysis 2026: Trends & Forecasts


Table of Contents
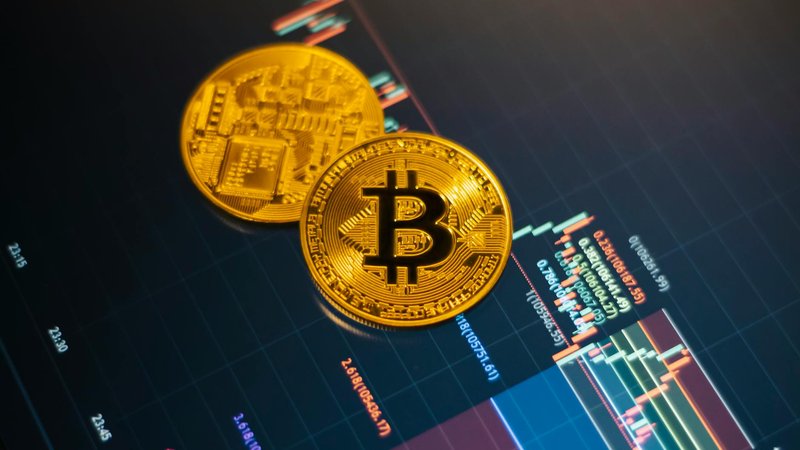
Q1 2026 closed with total crypto market cap at $4.5 trillion — a number that would have sounded delusional 18 months ago. But here's the paradox most analysts are missing: Bitcoin is flatlining around $112,690 while Ethereum Layer-2 activity exploded 25% quarter-over-quarter. Stablecoin supply broke through $275 billion. Tokenized treasuries doubled. And the GENIUS Act, signed into law last summer, has rewritten how American banks touch on-chain dollars.
This isn't another Bitcoin-dominant cycle. The capital rotation happening right now under the surface is the real story, and if you're allocating based on 2024 playbooks you're already behind. What follows is a complete cryptocurrency market analysis for 2026 — Q1 performance broken down by asset and narrative, post-GENIUS Act regulatory impact, technical setups on BTC and ETH, long-range forecasts out to 2035, and the portfolio frameworks I'm using right now.
Q1 2026 Market Overview: Performance by Asset and Narrative Shifts
The headline number — $4.5T total market cap — masks how lopsided this rally has been. Bitcoin dominance dropped from 58% in November to roughly 52% by end of Q1, and that 6-point shift represents hundreds of billions rotating into ETH, L2 tokens, RWAs, and select alts. If you only watched BTC, you missed the entire quarter.
Total Crypto Market Cap Hits $4.5T: What Drove Growth
Three forces pushed the market from the November 2024 peak of $3.2T to today's $4.5T print. First, stablecoin supply expansion poured fresh dollar liquidity into the system. Second, spot ETH ETF inflows averaged $180M per week through Q1 according to CoinGlass tracking. Third, the GENIUS Act unlocked banks and fintechs that had been sidelined for years.
BTC vs. ETH vs. Altcoins: Q1 2026 Return Comparison
| Asset | Q1 2026 Return | vs. BTC |
|---|---|---|
| Bitcoin (BTC) | +3.2% | — |
| Ethereum (ETH) | +22.4% | +19.2% |
| Solana (SOL) | +34.1% | +30.9% |
| Chainlink (LINK) | +41.6% | +38.4% |
| L2 basket (ARB/OP/BASE-related) | +28.9% | +25.7% |
Ethereum L2s Up 25%: The Layer-2 Explosion Explained
Daily transactions across Base, Arbitrum, and Optimism crossed 18M by mid-March. Base alone processed more daily transactions than Ethereum mainnet by a factor of 6. The Dencun upgrade cut L2 fees to fractions of a cent, and that fee compression is now showing up as user growth, not just throughput. CoinGecko data shows aggregate L2 TVL crossed $52B in Q1, up from roughly $41B at year-end 2025.
RWA Assets and DeFi TVL: On-Chain Metrics That Matter
Tokenized real-world assets hit $24B in Q1 2026 according to DefiLlama, with BlackRock's BUIDL fund alone holding over $3B. DeFi TVL recovered to $185B — still below the 2021 peak but climbing fast as RWA yields pull conservative capital on-chain. The tokenization narrative isn't speculative anymore. It's banks.
Altcoin Season Watch: Leaders, Laggards, and Rotation Signals
The altcoin season index sits at 68 — not full euphoria yet, but well past the BTC-only phase. Winners are concentrated in three buckets: ETH-correlated L2 plays, AI-data infrastructure (LINK, RNDR), and RWA-adjacent tokens. Losers? Most of the 2021-era L1 alternatives outside SOL. Memecoins remain choppy and lottery-ticket dominated.
Stablecoins and Tokenization: Post-GENIUS Act Boom and Metrics
The GENIUS Act was the most consequential piece of U.S. crypto legislation in a decade, and the market is still pricing in second-order effects. If you're trying to understand the 2026 cryptocurrency market analysis without factoring in this law, you're working with half the picture.
What the GENIUS Act Actually Changed for Stablecoin Issuers
Three things matter most. First, federally chartered banks can now issue payment stablecoins directly. Second, non-bank issuers like Circle and Paxos got a clear federal licensing pathway. Third, algorithmic stablecoins are effectively banned for retail use. The result is a flood of regulated bank-issued dollar tokens entering the market, and a consolidation around USDC, USDT, and the new wave of bank-branded tokens.
Stablecoin Supply Growth and Market Share in 2026
Stablecoin AUM crossed $275B in late 2025 and is tracking toward $310B by mid-2026. USDT still leads with roughly 58% share, but USDC has been gaining ground since the GENIUS Act passed, and PYUSD plus new bank-issued tokens collectively grew from 4% to nearly 11% market share in two quarters.
Tokenization of Real-World Assets: Banks, Funds, and On-Chain Activity
JPMorgan's Onyx is now settling over $2B daily in tokenized repos. Franklin Templeton, BlackRock, and WisdomTree collectively hold around $9B in on-chain treasuries. The interesting move is private credit tokenization — Maple, Centrifuge, and Goldfinch saw combined TVL grow 84% in Q1 alone. This is where institutional yield strategies are quietly being built.
Which Protocols Are Winning the Post-GENIUS Act Race
Ethereum captures roughly 62% of stablecoin supply, but Solana's share jumped from 4% to 9% on the back of payment-app integrations. Ondo Finance, Maker (now Sky), and Aave are the protocols with the cleanest moats post-legislation. Chainlink benefits indirectly as the dominant oracle for tokenized assets — which is why LINK was a Q1 leader.
Technical Analysis: Current Prices, Charts, and Short-Term Signals
Forecasts without technicals are guesses. Here's what the charts are actually saying right now with BTC at $112,690 and ETH at $3,981.
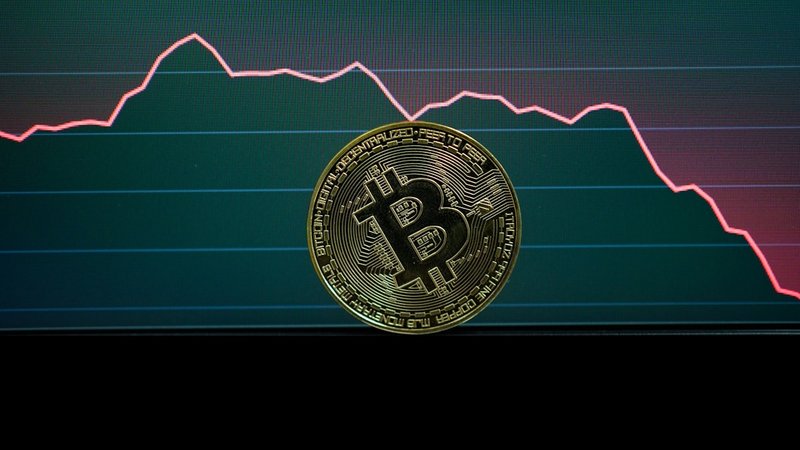
Bitcoin Technical Outlook: Key Support, Resistance, and RSI Levels
BTC has been compressing in a $108K-$118K range for six weeks. The daily RSI sits at 51 — neutral, no edge. The 200-day moving average is climbing toward $98K and acts as the line in the sand for the broader bull thesis. First resistance is $118,400, then $124,000. A daily close above $124K opens the door to $135K-$140K. A break below $105K invalidates the structure and shifts probability toward a $92K retest.
Ethereum Chart Analysis: L2 Activity vs. Spot Price Divergence
ETH has lagged its own fundamentals for most of 2025, but Q1 2026 closed that gap fast. The weekly chart broke out above $3,650 in February and is now consolidating below $4,100. The bullish divergence between L2 transaction growth and ETH spot price has finally started resolving upward. RSI on the weekly is 64 — strong but not overbought. Key levels: support at $3,650, resistance at $4,200, then $4,800.
Solana and LINK: Momentum Indicators and Breakout Zones
SOL broke a multi-month accumulation pattern at $215 and is consolidating near $248. MACD remains in positive territory with no bearish cross in sight. LINK is the cleaner chart — a textbook cup and handle with neckline at $28 and a measured move target near $42. Both are momentum names, not buy-and-forget positions.
On-Chain Metrics: Exchange Flows, Active Addresses, and Funding Rates
BTC exchange balances hit a multi-year low of 2.31M coins per CryptoQuant — historically a bullish setup. ETH active addresses crossed 850K daily, the highest reading since 2021. Perpetual funding rates are positive but moderate (0.01%-0.03% on Binance and Bybit), meaning longs are paying but not insanely crowded. No froth, no capitulation. This is mid-cycle behavior.
Short-Term Bullish vs. Bearish Scenarios for Q2 2026
Bull case: BTC breaks $124K on a Fed rate cut, ETH follows to $4,800, alt season index pushes past 80, total market cap tags $5.2T by end of Q2. Bear case: macro shock (geopolitical or credit event) drags BTC back to $92K, ETH to $3,100, and the L2 narrative cools temporarily. Base case is more grind than crash — sideways to higher with sector rotation continuing.
Scanning the market for setups like this manually takes hours. XeroGravity does it automatically — AI-powered signals with entry, take profit, and stop loss levels delivered to your dashboard in real time. Start free.
2026 to 2035 Forecasts: Growth Projections, Risks, and Opportunities
Long-term forecasts are only useful if they're anchored to specific scenarios with clear invalidation points. Here are mine.
Bitcoin Price Targets: Base, Bull, and Bear Cases for 2026
Bear case: $85,000 (15% drawdown driven by macro shock or ETF outflows reversing). Base case: $145,000 (steady ETF accumulation, no recession, halving supply shock continues to bite). Bull case: $185,000-$210,000 (Fed cuts aggressively, sovereign adoption accelerates, MicroStrategy-style corporate treasuries proliferate). I'm anchoring my own book to the base case with bull-case option exposure.
Ethereum and L2 Ecosystem Projections Through 2028
ETH base case for end of 2026 is $6,200, with bull case extending to $8,500 if L2 fees fully migrate to ETH burn via blob economics. By 2028, base case is $9,000-$11,000 assuming continued stablecoin and RWA dominance on Ethereum. Watch the L2 fee-to-mainnet capture ratio — that's the single most important metric for ETH's long-term price thesis.
Altcoin Forecast: SOL, LINK, and Emerging Narratives
SOL base case end of 2026: $340. Bull case: $480. LINK base case: $48. Bull case: $72 if RWA tokenization adoption keeps compounding. Emerging narratives to watch: AI-data oracles, decentralized GPU networks, and Bitcoin L2s (which are still small but growing fast).
Total Crypto Market Size Projections to 2030 and 2035
Industry consensus puts the broader crypto market CAGR at 14.5% through 2033, but that number undershoots if you separate infrastructure from speculative tokens. Extending the trend with realistic adoption assumptions: $8.5T market cap by 2028, $14T by 2030, and $22-28T by 2035 in the base case. Bull case touches $40T by 2035, driven primarily by tokenized real-world assets rather than native crypto.
Macro Factors That Could Accelerate or Derail Growth
Three accelerators: dovish Fed pivot, expanded U.S. spot ETF approvals (SOL, XRP, LINK all pending), and aggressive bank stablecoin issuance. Three derailers: U.S. recession with credit contraction, geopolitical conflict creating risk-off flows, and any major exchange or stablecoin failure that triggers contagion.
Top Investment Strategies: Portfolio Allocation and Risk Management
Forecasts are useless without an allocation framework. Here's how I'd structure exposure right now for both retail and institutional capital.
Core vs. Satellite Portfolio: BTC and ETH Anchors with Altcoin Exposure
For a retail crypto allocation, the framework I'd use today: 40% BTC, 30% ETH, 15% large-cap alts (SOL, LINK), 10% sector bets (L2s, RWA tokens, AI infra), 5% stablecoins for dry powder. Institutional allocations skew heavier on BTC (55-60%) given mandate constraints, but the ETH overweight thesis is gaining ground.
DeFi and L2 Allocation: Best Risk-Adjusted Opportunities in 2026
On a risk-adjusted basis, ETH itself is the cleanest L2 trade — you get exposure without single-protocol token risk. For higher beta, a basket of L2 governance tokens sized at 3-5% of portfolio captures upside without concentration. Aave and Sky (formerly Maker) are the DeFi blue chips I'd hold core positions in.
RWA and Stablecoin Yield Strategies for Conservative Investors
Tokenized treasuries through Ondo, Maple, or BlackRock's BUIDL yield 4.8-5.4% with minimal smart contract risk. Stablecoin lending on Aave runs 6-9% APY with manageable risk. Pair this with a small BTC core position and you get a conservative crypto allocation that beats most TradFi cash strategies.
Using On-Chain Metrics and Sentiment to Time Entry and Exit
Three signals I weight heaviest: exchange netflow (sustained outflows = bullish), stablecoin supply growth (expansion = imminent bid in risk assets), and funding rates (sustained above 0.05% = caution, time to trim). Combine these with the altcoin season index and you have a framework that beats sentiment-only approaches.
Stop-Loss Levels, Position Sizing, and Drawdown Management
Never risk more than 1-2% of total portfolio on a single leveraged trade. Spot positions can sit through 30-40% drawdowns; leveraged positions cannot. Use position sizing based on volatility — a 5x BTC long needs roughly 4x more stop-loss room than a 5x altcoin long because of volatility differentials. Track your max drawdown weekly and cut size if you exceed your tolerance band.
Key Risks and What to Watch in H2 2026
Every analysis needs to spell out what kills it. Here's the watchlist.
Interest Rate Policy and Fed Decisions: Crypto Correlation Risk
Crypto's 60-day correlation to the Nasdaq sits at 0.62 — high enough that Fed surprises move BTC meaningfully. Any hawkish pivot or stalled rate-cut cycle could shave 15-20% off the market quickly. Watch the FOMC meetings in June, July, and September.
Geopolitical Flashpoints and Liquidity Shock Scenarios
Middle East escalation, Taiwan tensions, or a major European credit event would trigger risk-off flows that hit crypto harder than equities historically. Keep a stablecoin buffer of 5-10% to deploy into dislocations.
Regulatory Wildcards Beyond the GENIUS Act
The pending market structure bill, SEC commissioner turnover, and potential tax treatment changes are all in play. International regulation — particularly MiCA enforcement in Europe and Asian market access rules — could reshape exchange landscapes mid-year.
Market Structure Risks: Leverage, Liquidations, and Exchange Health
CoinGlass data shows aggregate open interest crossed $95B in Q1 2026 — near record highs. When OI gets stretched and funding rates climb above 0.08%, expect a flush. Monitor exchange proof-of-reserves quarterly. Lessons from FTX still apply.
H2 2026 Catalyst Calendar: Events That Could Move Markets
Key dates: Q3 spot ETF decisions on SOL and XRP, Ethereum's next major upgrade window, U.S. midterm election positioning, and the September FOMC. Any one of these can re-rate sectors by 15-30% within weeks.
The Bottom Line for 2026
The stablecoin supercycle is real, the L2 thesis is playing out in real-time data, and the post-GENIUS Act regulatory clarity has unlocked institutional capital that was sidelined for years. But none of this matters if you're trading without a framework. The traders who compound through 2026 will be the ones combining sector rotation discipline with strict risk management — not the ones chasing every narrative.
Build your core around BTC and ETH. Take satellite exposure to L2s, RWAs, and select alts. Use on-chain metrics and funding rates to time entries. Cap leverage. And never confuse a strong quarter with permission to abandon risk rules.
Want signals built on this exact framework? XeroGravity's AI scans BTC, ETH, SOL, and top altcoins 24/7 and delivers complete trade setups — entry, stop loss, and take profit levels — direct to your dashboard. Try it free.
Frequently Asked Questions
Chainlink (LINK) was the top performer among major caps in Q1 2026 with a +41.6% return, driven by its dominant position in oracle infrastructure for tokenized real-world assets post-GENIUS Act. Solana followed at +34.1%, with Ethereum L2 tokens averaging +28.9% as a basket. Bitcoin underperformed at +3.2% as capital rotated into higher-beta plays.
The GENIUS Act gave federally chartered banks the legal authority to issue payment stablecoins directly and created a clear federal licensing pathway for non-bank issuers like